Quantitative research · 2026
Point-in-Time Equity Drawdown Risk
Can a model rank the risk of a severe 15% drawdown over the next 40 trading days using only information available at each prediction date?
Quantitative research · 2026
Can a model rank the risk of a severe 15% drawdown over the next 40 trading days using only information available at each prediction date?
Rapid price gains sometimes end in severe drawdowns, but not every stock is equally exposed. The task was to rank that risk using only data available on the prediction date, while avoiding survivorship bias.
On 91,299 S&P 500 observations, the highest-risk decile had a 26.28% event rate versus 7.44% in the lowest-risk decile. The frozen model then transferred to 85,587 S&P 400 observations.
Replication summary
[PASS] Frozen-model transfer criteria met
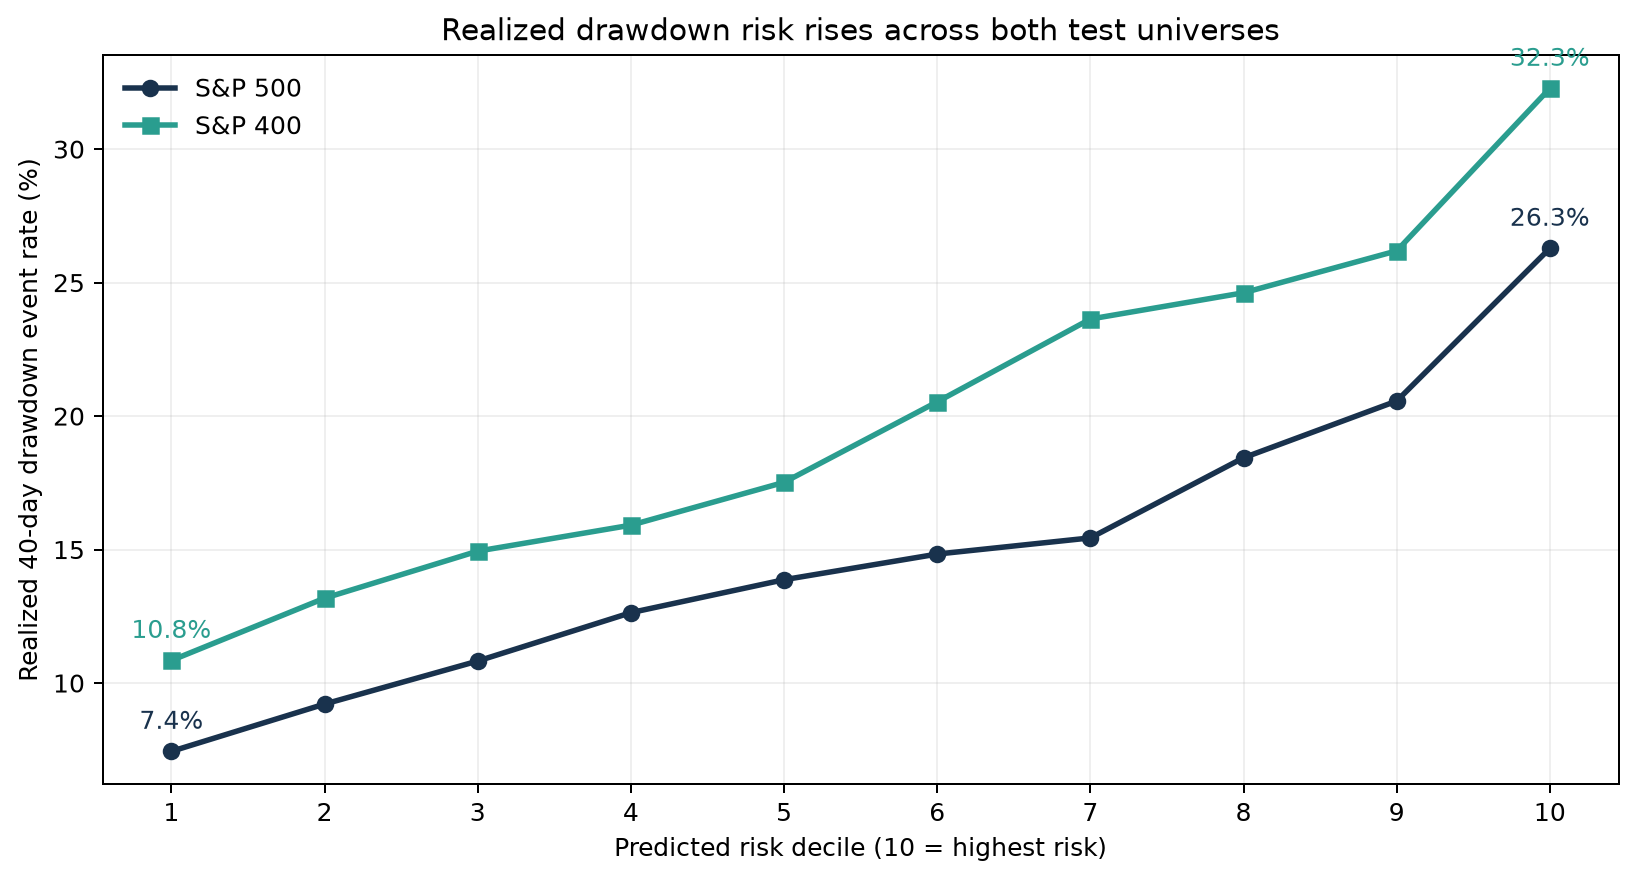
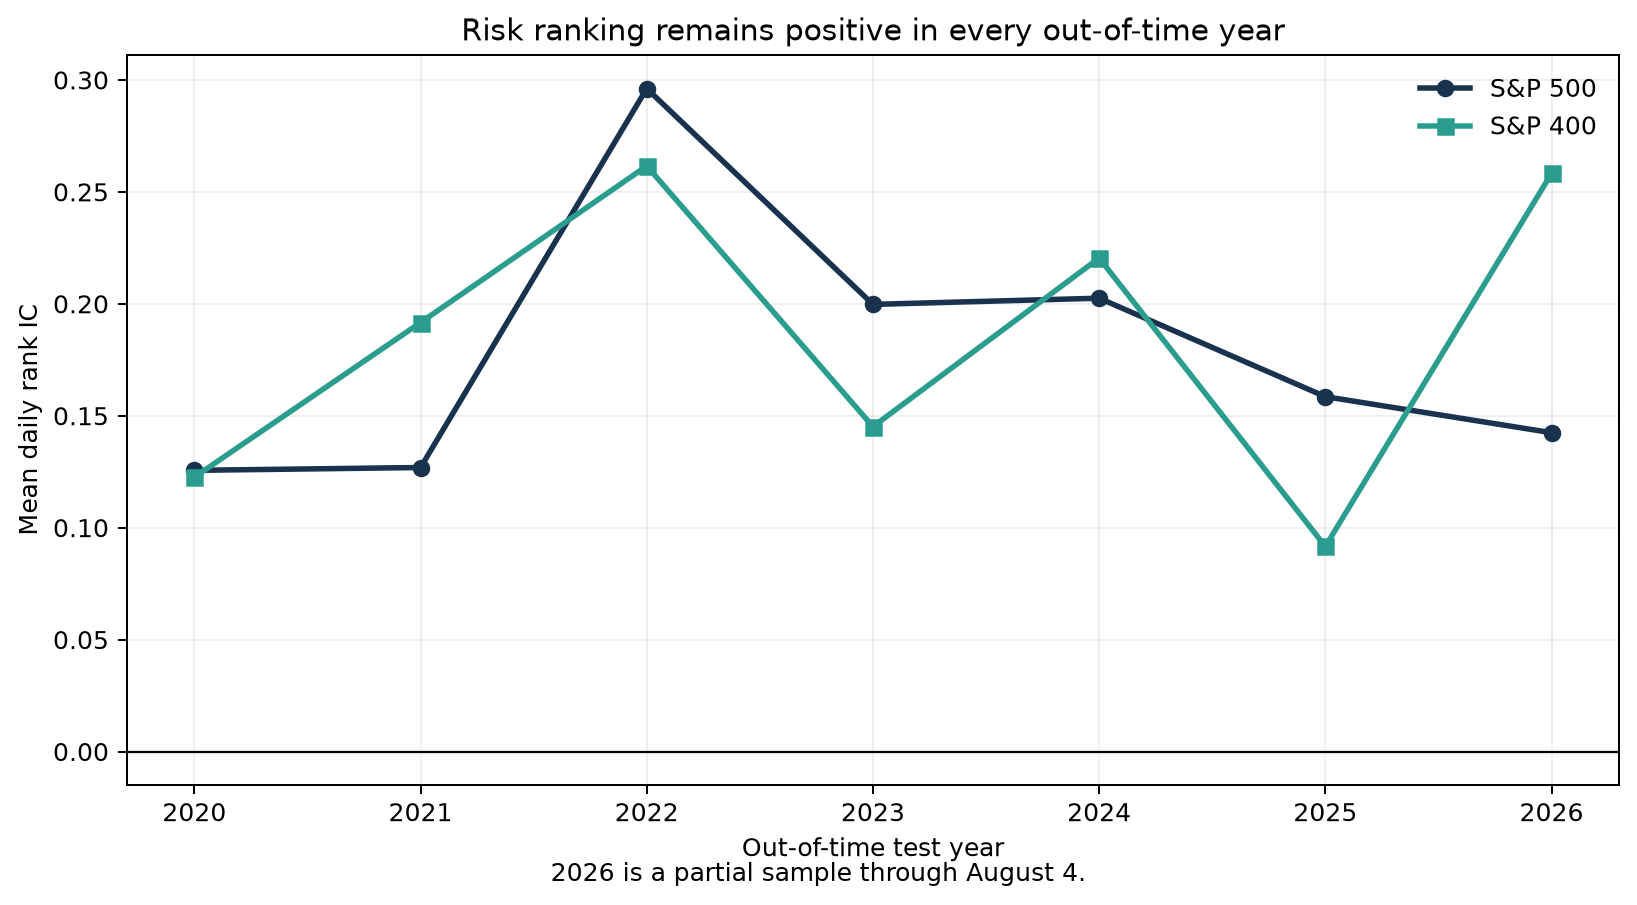
The model consistently separated lower- from higher-risk stocks, but the study did not establish reliable alpha. I also added monitoring and 84 automated tests so the pipeline can be rerun and checked.